
5. Energy Map
5.1 Selecting wind- and turbine data
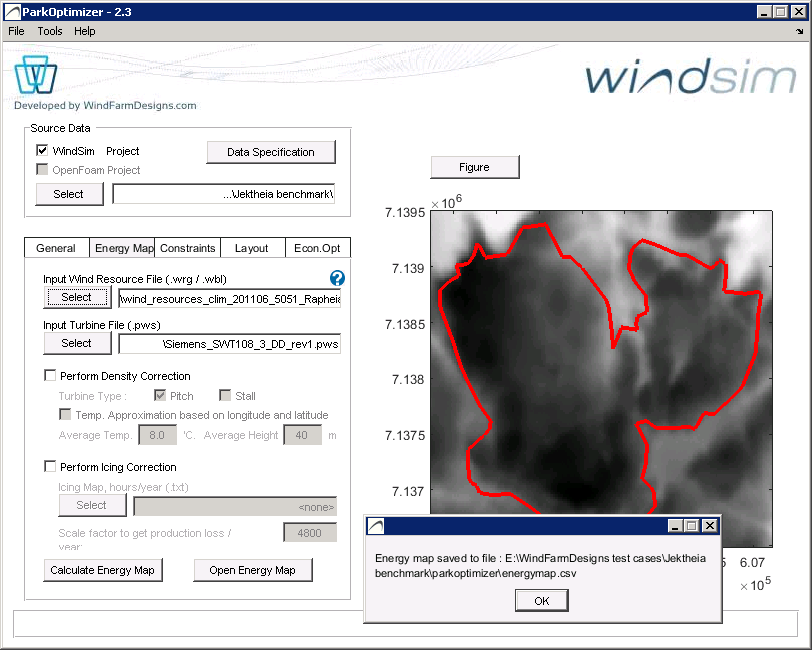
Select the Wind Resource wrg file, specifying the Weibull parameters for the sectors at each point, and the Turbine Specification pws file giving the power-curve PC. The energy at each point is calculated as the sum over sectors of
integral( wbl(v, A, k) · PC(v) · f dv ), over v = 4,…,25
where wbl is the Weibull probability distribution function with parameters (for each sector) A, k and frequency f. After the calculation, energymap.csv and the Google Earth energymap_ge.kml / windmap_ge.kml are saved to the Results Directory. The energymap.csv can be loaded instead of recalculating the energy.
5.2 Perform density correction
Air density at site locations may vary from the standard 1.225 kg/m³ conditions specified for power curves. Two methods are provided:
- User manually inputs average Temperature (°C) and Height (m) above sea level of the wind farm.
- Automatically correct density based on lat/lon coordinates.
5.3 Perform icing correction
Production loss from icing can be corrected using an icing map loaded as a .txt file of coordinates and hours_icing/year (x y hours per line). A scaling factor is defined so that Production loss from icing [MWh/yr] = (hours_icing/yr) / ScalingValue. Default scaling value is 4800.